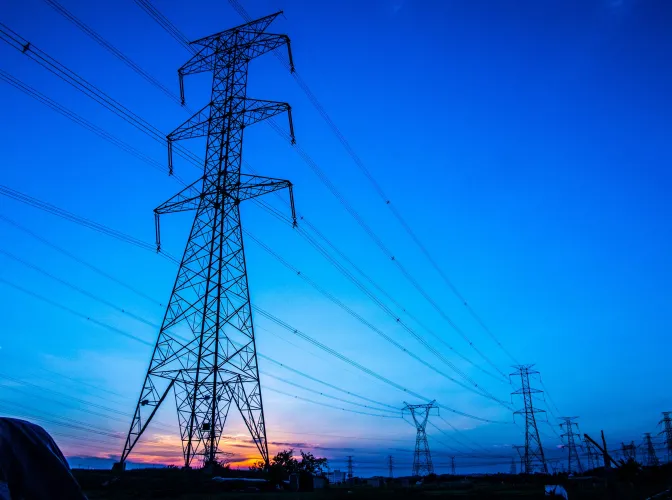
The pressure on the electricity grid in the Netherlands has two main causes: first, the use of natural gas is decreasing and electricity is increasing. Second, electricity is no longer generated only at a small number of central locations . Wind and solar farms ensure that electricity can be generated in all sorts of places and fed back into the grid. So one-way traffic becomes two-way traffic. In addition, wind and solar energy depend on the weather, so their generation does not continue day and night. This makes the associated use of the grid less manageable.

To meet this growing and changing demand, the electricity network we have built over the past 60 years would have to double in the next 10 years, says Roel Bouman, a data scientist at Radboud University. But there are too few people to get that done and procedures surrounding permits lead to wasted time. In short: expanding the electricity network is being worked on, but not fast enough.
Whether it can also be done smarter is the question Bouman and fellow data scientists from Radboud University and Alliander set to work on. "Can we find space on the existing network in a smart way so that we use it optimally?
Filtering measured data for better insight into capacity
Jacco Heres, involved in this project as a data scientist at Alliander, shows a map of the overcrowded electricity network. It looks like there is not a shred of space left in the transmission capacity (consumption) and supply capacity (production). Yet a company like Alliander has to investigate that, when applying for new connections. 'That further investigation is done by technical experts. They determine from measurement data how much of the available capacity is actually being used. Such an investigation is time-consuming and error-prone. This is not the fault of the experts: the measurement series they have to work with are often disrupted by measurement errors or switching events. The latter occurs when there is a detour, such as a cable break. Then switching to another route takes place. But in the measurement data it then seems as if a lot more capacity is being used via that alternative route, because the use of the original route is also taken into account. That kind of error has to be filtered out, but that's actually not easy to do manually.'
Typical of a problem where artificial intelligence (AI) comes in handy. 'We developed a self-learning system to automatically filter out these types of measurement errors and switching events. It still requires some manual work, but we have reduced the work of the technical experts by 75 percent.'
The system also provides better quality data, Bouman says. 'Nothing to the detriment of the technical experts, but it's just not doable to take complete time series in hand. It simply takes too much work. Now that our system allows us to enter more data, we get filtered data out that gives better insight into capacity estimation. In addition, we can now see trends, because with more data we can look beyond peak load: the times when the grid is busiest.'
Filtered data are prerequisite for smart solutions
The system developed by data scientists at Radboud University and Alliander is called STORM. It is now being used at Alliander. Jacco Heres explains that while STORM does not solve the problem of the full grid, it does make an important contribution. 'In order to devise smart solutions to the congestion problem, usable, filtered data are a prerequisite. More measurements are currently being hung in the electricity grid at a rapid pace - you have to take that quite literally, think of measuring boxes in transformer houses - with a view to flexible energy supply. Or to determine, for example, whether we can thermally load cables more heavily for a short time, i.e., that more current can flow through them, when we know they can cool down again afterwards. We collect a lot of measurements, but without a good filtering algorithm we have no use for them, because there are far too many to go through by hand.'
Because so many measurements are involved, the team behind STORM continues to work on improving them. Heres: 'That we have reduced the work for the technical experts by 75 percent is nice, but 99 percent would be even nicer. Especially since the number of measurements is only increasing.'
Explainable AI: it must be explainable
Also important in the development of STORM from the outset was the need for a system that is easy to interpret and thus produces data that is easy to explain. Explainable AI is something that data scientists and AI experts at Radboud University are strong on. Bouman: "The technical experts have to be able to say more than, 'it can't be done because the computer says no.' They must also be able to explain why it is no. Because if Alliander says there is no room, a customer such as a project developer or municipality can object and then you have to be able to explain how you came to a decision.'
Open science
STORM is a beautiful and successful result of the collaboration between Alliander and Radboud University. Bouman: "We are happy with it. It is a nice interaction: we also want to do interesting and relevant research and for that you need a lot of relevant data and knowledge of the context in which it is collected, processed and used. And what I also like is that Alliander is not keeping the idea behind STORM to itself. The publication and the data are open. Alliander is using it and with it we are already helping a third of the Netherlands. But other network companies can also benefit from this.'
Bron: RU


